
Webserver for Position Related data analysis of gene Expression in Prokaryotes
Help Version: 1.1
Index
Introduction
WoPPER - Webserver for Position Related data analysis of gene Expression in Prokaryotes -is a web-tool for the analysis of bacteria transcriptomic data. Gene expression is integrated with genomic annotations to reveal connections between transcription regulation and structural organization of bacterial genomes.
Both Microarray and RNA-Seq data can be used as inputs for WoPPER. The analysis produces, as outputs, clusters of positionally related genes having the same trend of differential modulation of expression and graphical outputs of the modulated clusters.
WoPPER is implemented in AngularJS, a structural framework for dynamic web applications, on the basis of the R-package PREDA, developed by Ferrari F. and co-workers in 2011 1 to identify regional variations in genomic data.
WoPPER is available without registration at http://WoPPER.ba.itb.cnr.it/ or https://WoPPER.ba.itb.cnr.it/ - SSL secure connection.
PREDA Package Version
WoPPER is based on the release 3.4 of PREDA package (Bioconductor Preda , last update: 17/10/2016). Since PREDA is currently under constant improvement and development, we are planning to keep WoPPER updated to the future releases of PREDA package.
Browser Compatibility
WoPPER, based on AngularJS framework, has been tested with major modern browsers such as Google Chrome (5+), Mozilla Firefox (3+), Safari, and Safari for iOs (10+), as well as Microsoft Internet Explorer (11+) and Microsoft Edge (AngularJS FAQ ). Known Issues: in Internet Explorer PNG/SVG downloads don't work. Thus, WoPPER should work on any recently updated browser. For a better usage, we recommend users to access WoPPER using Chrome or Firefox from a computer with at least 4G RAM and 1200 x 800 screen resolution.
If you encounter an issue with your browser, try updating it to the latest version (Browse Happy ). If you still have problems, contact us: bigstaff@ba.itb.cnr.it
Examples and Experiments
At the top of the WoPPER page, the first two drop-down buttons allow users to have a look at some datasets that can be used as examples of WoPPER experiment and functionalities and to show the executed experiments whereas the last button allows to set up form input maintenance.
- Examples (
 ) activates an auto-complete function which automatically fills in all the required files for the selected dataset and allows the user to have a look on how the input form should be filled in and proceed to launch WoPPER analysis with a simple click on “Execute” radio-button at the bottom of the page.
 - Experiments (
 ) exposes the drop-down menu that will show up the latest experiments executed within specific user's browser.
 - Session (
 /
/  ) enables the "Session Storage" mode. Input form data is locally stored within the browser until the timeout of the browser session. Saved data survive over page reload even when the user closes the browser, surfs away from WoPPER website or exits a browser tab. This modality helps users to analyze multiple dataset on the same genome. The switch must be activated before performing the analysis; de-activating the switch will disable the input form data storage.
The complete step-by-step analysis of the same datasets starting from GED files and (in Helicobacter G27 example) a custom annotation can be found in the Help/Tutorial ⟹ Tutorials page.
Initial Settings
For each experiment, WoPPER allows the user to:
- Provide a meaningful name for the experiment
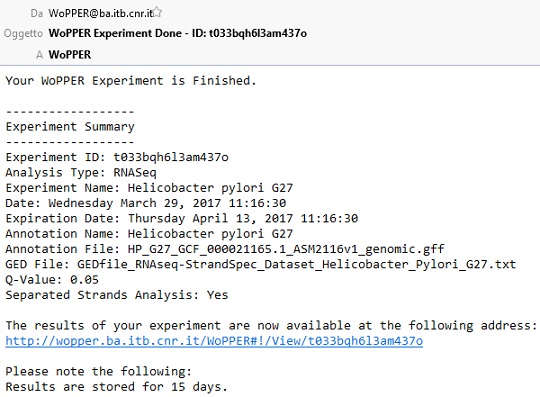
- Provide an (optional) email address to which a message will be sent upon completion or failure of WoPPER. An email, similar to the one in the following screenshot will be sent, with a link to experiment data. The experiment ID is a unique identifier that allows retrieving of the corresponding data for a maximum of 15 days, after which all experiment data will be cancelled.
- Select which type of data is used, choosing from:
- RNA-Seq (for gene expression experiments performed by next-generation sequencing).
- Microarray (for gene expression experiments performed by custom or commercial microarray technology).
Input Files
Mandatory inputs for WoPPER execution are:
- A list of genes for the proper organism and the related gene expression Log2 fold changes (quantifying the change of expression across the two analyzed experimental conditions).
- A genome annotation (either a custom annotation file or one selected from the drop-down menu).
WoPPER requires the user to upload at least one file containing a list of gene expression fold-changes (in log2 format). Custom genome annotation can be provided in different file formats, as long as they are built according to some specifics (see below, in the “Genome Annotation” section).
Gene Expression Data File
A file containing gene expression data (GED) for either RNA-Seq or microarray experiment is the only input that must be provided to WoPPER in all settings.
- GED file must be a plain-text file containing at least 2 columns:
- One column containing the gene names. These names must match those provided in the corresponding field of the Genome Annotation (see below). WoPPER will use this information to match GED values and the gene coordinates of the selected bacterial genome.
- One column containing the gene expression values. This value must be a Log2 fold change (i.e.: a log transformed ratio of expression values between two experimental conditions). WoPPER automatically removes “NA”, “NaN” and ± ∞ from the gene expression values columns.
- The input file can contain also additional columns that will not be taken into account for WoPPER analysis.Thus, it is not necessary to create an ad hoc GED file with only the two mandatory fields, provided that the correct column index corresponding to these two is indicated in the input form.
- Moreover, this file can also have an arbitrary number of header lines. As above, the user is only required to indicate in the input form whether the file has a header and how many rows the header consists of, which will be skipped by WoPPER when parsing the input file.
- The column separator can be set selecting from TAB, SPACE, comma (“,”) or semicolon (“;”).
Clicking on the “Preview” button ( ) allows quick check of the provided GED file, in order to correctly indicate column numbers for Gene Name and Log2 fold change and eventual header lines.
Note: GED file must contain the unfiltered gene expression values, that is the Log2 fold change of all the genes, without any previous selection. Loading such kind of data (e.g.: only differentially expressed genes) will cause WoPPER to give meaningless results.
Note: after loading the GED file, users must Validate it clicking on the corresponding radio-button. When the GED file is valid, the radio-button turns green, otherwise, it turns red.
| GED file requires checking | Valid GED file | Non-valid GED file |
|---|---|---|
 |  |  |
Genome Annotation
Genome annotation can be provided either as a custom file (Custom Genome Annotation tab) or by selecting one of the annotations pre-loaded in the internal WoPPER database (derived from bacterial genome annotations by the National Center for Biotechnology Information of the National Institute of Health) (NCBI Genome Annotation).
NCBI Genome Annotation
Users can select one of the pre-loaded NCBI bacteria genome annotations (NCBI Ftp /genomes/archive/old_refseq/Bacteria/ , last updated on 13/06/2013), containing complete information about 2780 bacterial strains (including 2970 chromosomes and 2188 plasmids) 2. Organisms with more than one chromosome are listed with a separated record for each chromosome (named as “chr1”, “chr2”, etc.). Similarly, plasmids for each reference (where present) have been listed separately and can be used in case users have Gene Expression Data also from plasmid genes.
In order to select the proper strain from the drop-down menu, the user has to type just 3 or more characters of the strain name to activate the automatic search in the database.
Clicking on the “Preview” button () allows quick check of the Genome Annotation selected.
Note: check that the “Gene Name” field contains the same values as the GED file, otherwise WoPPER will not process the data.
Note: organisms with more than one chromosome or containing plasmids must be analyzed one chromosome-at-a-time, selecting the correct genome annotation from the database.
Custom Genome Annotation
Alternatively, users can provide their own preferred genome annotation, provided the custom annotation file fulfills the specific requirements listed below.
Note: organisms with more than one chromosome or containing plasmids must be analyzed one chromosome-at-a-time. Thus, when building custom genome annotations, users have to provide separate files for each chromosome and plasmid.
- Users can submit a custom gene annotation file in one of the recognized file formats:
- BED
- GFF
- CSV/TSV
- Users can indicate (optionally):
- An annotation name.
- A chromosome size (which is useful for drawing plots of a correct size in WoPPER Circular Plot and Linear Graph outputs, see below).
- This file can optionally have a custom number of header lines at the top.
- Column separator can be set selecting from TAB, SPACE, comma (“,”) or semicolon (“;”).
BED Format
Gene annotation in Browser Extensible Data format (BED) must be provided according to the UCSC standard, with at least 6 columns (also called “BED6” format) (https://genome.ucsc.edu/FAQ/FAQformat#format1).
BED file fields must contain the following information:
- chrom – The name of the chromosome or scaffold.
- chromStart – The starting position of the gene in the chromosome or scaffold. The first base in a chromosome is numbered 1.
- chromEnd – The ending position of the gene in the chromosome or scaffold.
- name – Defines the gene name.
- score – not used. Please that the field cannot be empty, but must contain a value (set it to “0” or “.” if the BED file has no score associated to the gene).
- strand – Defines the transcription strand for each gene. Either "+" or "-".
An example of a valid Genome annotation BED6 file for use in WoPPER is reported below.
GFF Format
Alternatively, annotations can be provided also in the General Feature Format (GFF) format, which has nine required fields that must be tab-separated. Please, refer to https://genome.ucsc.edu/FAQ/FAQformat#format3 and http://gmod.org/wiki/GFF3 for the complete description of this format.
GFF file fields must contain the following information:
- seqname – The name of the chromosome or scaffold.
- source – not used. Please note that the field cannot be empty, but must contain a value (set it to “.” if the GFF file has no value associated to this field).
- feature – The feature type (e.g.: "gene”, “CDS”, “tRNA”, etc.).
- start – The starting position of the feature in the chromosome or scaffold. The first base is numbered 1.
- end – The ending position of the feature in the chromosome or scaffold.
- score – not used. Please note that the field cannot be empty, but must contain a value (set it to “0” or “.” if the GFF file has no score associated to the feature).
- strand – Valid entries are “+”,“-”, or “.” (for not available/not relevant).
- frame – not used. If the feature is a coding exon, frame should be a number between 0-2 that represents the reading frame of the first base. If the feature is not a coding exon, the value should be “.”. Please note that the field cannot be empty, but must contain a value.
- attributes – A list of feature attributes in the format tag = value. Multiple tag = value pairs are separated by semicolons.
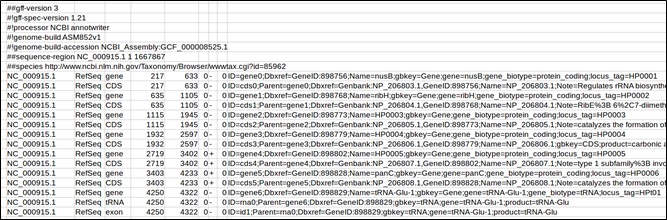
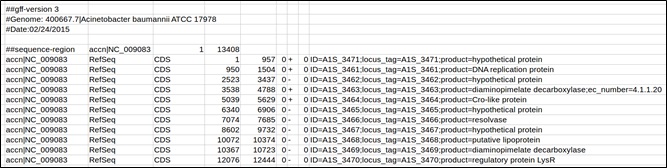
Note: Please check that records defining gene features have a pair: “locus_tag = LOCUS_NAME” in the “attributes” section (column 9), since WoPPER infers the gene name from this tag-value pair.
Note: Valid GFF files are those downloaded from NCBI (https://www.ncbi.nlm.nih.gov/) and Patric (https://www.patricbrc.org/) and custom genome files formatted accordingly. Please, be sure to upload only plain text files to WoPPER since it does not accept compressed formats (e.g.: zip, gzip or bzip archives).
Example of a GFF downloaded from NCBI
Example of a GFF downloaded from Patric
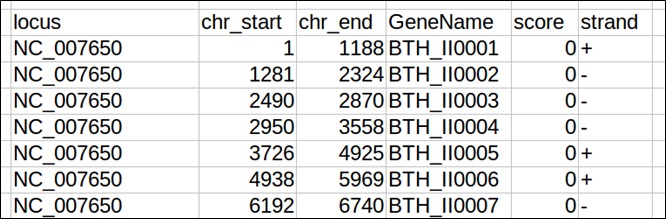
CSV/TSV Format
Finally, annotations can be provided also as a separated-columns text. Column separator can be chosen among TAB, SPACE, comma (“,”) or semicolon (“;”). This file must have 5 columns.
CSV file fields must contain the following information:
- chrom – The name of the chromosome or scaffold.
- chromStart – The starting position of the gene in the chromosome or scaffold. The first base in a chromosome is numbered 1.
- chromEnd – The ending position of the gene in the chromosome or scaffold.
- strand – Defines the transcription strand for each gene. Either "+" or "-".
- name – Defines the gene name.
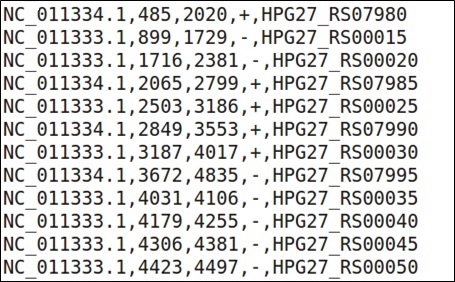
An example of a valid Genome annotation CSV file for use in WoPPER is reported below.
Other Parameters
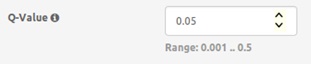
- Q-value: threshold q-value of the statistical model used for determining the significant genomic regions (i.e.: clusters).
- Separated Strands Analysis: specifies whether the position-related analysis of gene expression should be performed separately on each strand (i.e.: considering alternatively only genes on “+” and “-“ strand) or considering the genome as a whole.
Note: The Separated Strands Analysis could not be reliable for small bacterial genomes (indicatively, having less than 2000 genes), since separating the analysis would result in WoPPER building its statistical model on too few points and originating inaccurate clusters.
| Q-value input mask | Separated Strands Analysis button |
|---|---|
 |  |
Execution
Once all the mandatory inputs have been provided, WoPPER can proceed to execution step.
- The blue box at the bottom of the page shows if all the inputs have been properly provided.
- The “Execute” radio-button will be clickable only if all inputs have been properly provided.
| All inputs correctly provided | |
|---|---|
 |  |
| Some input missing or incorrect | |
 |  |
A new page will show information about:
- Results options. In particular:
- Start (
 ) loads a WoPPER starting page. If "Session ON" button is switched, the starting form will be pre-compiled with the settings and files of the previous analysis, otherwise the starting form loaded will be empty.
 - Experiments () exposes the drop-down menu that will show up the latest experiments executed within specific user's browser.
- Delete Experiment (
 ) removes the current experiment from server storage and experiments listed in drop-down menu.
 - A summary of the analysis information. In particular:
- Experiment ID: contains the unique identifier of the WoPPER job, which can be bookmarked and used for redirection to results page one WoPPER has finished analyzing the data. This is particularly useful when no e-mail address was provided in the Experiment information section.
- Date: indicates the job start in local time (i.e.: Central European Time - CET).
- Expiration Date: indicates the date (in local time) on which experiment data will be removed from the server.
- The selected Genome Annotation, including:
- Total number of genes in the annotation.
- Chromosome name.
- Chromosome size.
- The selected GED file, including the number of genes for which the Log2 fold change in gene expression value has been provided.
- The Q-value set as threshold and if the analysis is performed for Separated Strands or not.
Outputs
WoPPER provides the user three different types of outputs that summarize all the results obtained from the application of the PREDA analysis on the input dataset. Each output type is described briefly below.
Tabular Output
Tabular output represents a text version of WoPPER results. A list of the identified clusters is available, as well as the possibility to sort, filter and download the cluster information. An example of tabular output is reported in figure 1. Numbers in the figure correspond to the related numbered list entry below, describing each field.
- Download of the data can be activated clicking on the corresponding button. Data are in zip-compressed archives and can be opened and edited as tab-separated files.
- WoPPER reports in the “Total Clusters” field the overall number of clusters found on that specific chromosome and analysis.
- Tabular data report the following fields:
- ID: Progressive number of the cluster. By default clusters are ordered according to the start coordinate on the reference genome.
- Cluster Start: Starting coordinate of the cluster on the chromosome.
- Cluster End: Ending coordinate of the cluster on the chromosome.
- Cluster Width: Size of cluster in bp.
- # Genes: number of genes belonging to the cluster.
- Genes in Cluster: ID of genes belonging to the cluster.
- Strand: whether the cluster is on the “+” or “-” strand of the reference genome.
- Expression trend: clusters are reported in green and with a down-ward pointing arrow for down-regulated clusters; clusters are reported in red and with an up-ward pointing arrow for up-regulated ones.
- Log2 FC Mean: average cluster fold change, calculated as the arithmetic mean of the Log2 fold change values for all the genes in the cluster.
- Log2 FC SD: standard deviation of the cluster Log2 fold change, calculated as the standard deviation of the Log2 fold change values for all the genes in the cluster.
- Clicking on the columns the user can re-sort the cluster table (in ascending or descending order) according to any other field (such as genomic position, cluster width, etc.).
- It is also possible to filter for Strand (reporting only clusters on “+” or “-” strand) or Expression Trend (reporting only clusters of upregulated or downregulated genes).
- Typing in the box below “Gene in Cluster” box, it is possible to search directly for a specific Gene Name to check to which cluster (if any) it belongs.
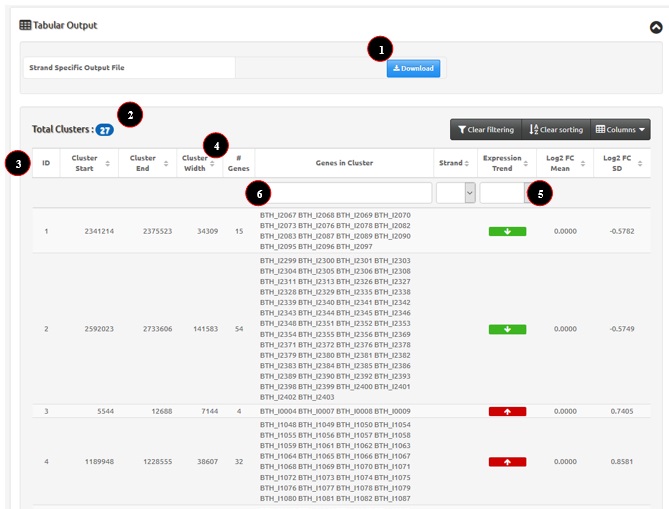
Figure 1: example of WoPPER Tabular Output.
Circular Plot Output
The circular plot represents the bacterial chromosome as a circle in which genomic features and gene cluster determined by WoPPER are visualized. This is particularly useful to highlight cluster densities, location and strandness all in one plot. The image can be easily downloaded for use in publications or presentations.
An example of circular plot is reported in Figure 2. Numbers in the figure correspond to the related numbered list entry below, describing each field.
- Download of the plot can be activated pressing the corresponding button. Images can be saved either as a Portable Network Graphics object (PNG) or as a Scalable Vector Graphics object (SVG) for print-ready quality.
- The circular plot shows two concentric circles:
- The outer circle is for positive (+) strand genes.
- The inner circle is for negative (-) strand genes.
- The gray shaded areas are gene coordinates.
- Gene clusters are highlighted in red if up-regulated genes and in green if down-regulated genes.
- Moving the mouse pointer above a gene opens a popup providing information about gene name and location.
- Moving the mouse pointer above a cluster opens a popup with information about cluster characteristics (i.e.: mean Log2 fold change, standard deviation of Log2 fold change, cluster coordinates, genes within the cluster).
- Color blindness filters can be applied pressing the corresponding button. In colorblind circular plot gene clusters are highlighted in yellow if up-regulated genes and in blue if down-regulated genes.
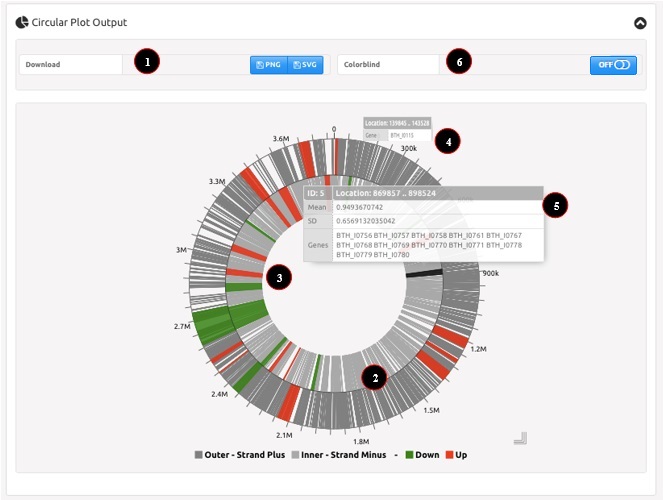
Figure 2: example of WoPPER Circular Plot Output.
Linear Graph Output
The linear graph represents the bacterial chromosome in linear coordinates and reports the average Log2 fold change for gene clusters. An example of tabular output is reported in Figure 3. Numbers in the figure correspond to the related numbered list entry below, describing each field.
- Download of the plot can be activated pressing the corresponding button. Images can be saved either as a Portable Network Graphics object (PNG) or as a Scalable Vector Graphics object (SVG) for print-ready quality.
- Coordinates on bacterial chromosome are reported on the X-axis.
- Average Log2 fold change for gene clusters is reported on the Y-axis.
- Gene clusters are reported as a colored (red for up-regulated or green for down-regulated) dot at the intersection between their genomic position (start coordinate) and their average Log2 fold change value. Dot size is directly proportional to the cluster width and the dot is accurately plotted on the X-axis.
- If applicable (i.e.: analysis with separated strands), clusters on the “positive” strand are reported in orange, whereas clusters on the “negative” strand are reported in blue. Otherwise (i.e.: analysis without separated strands), only a single line connecting the points will be shown.
- Moving the mouse pointer above a cluster opens a popup with information about cluster characteristics (i.e.: mean Log2 fold change, standard deviation of Log2 fold change, cluster coordinates, genes within the cluster).
- Color blindness filters can be applied switching the button. In colorblind linear plot dots are showed in yellow if up-regulated genes and in blue if down-regulated genes.
- Interactive graph lets users to visualize features on plus or minus strand by clicking the mouse on "Strand Plus/Minus Cluster" labels.
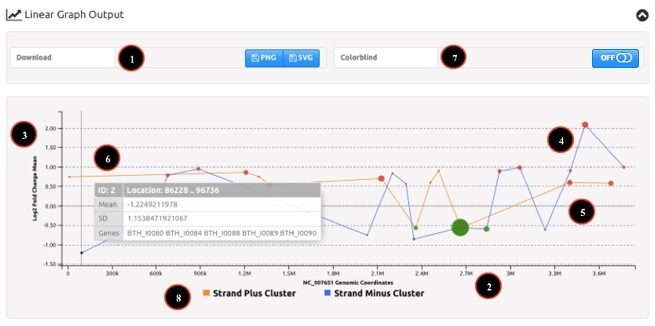
Figure 3: example of WoPPER Linear Graph Output.